Meaning of Cost Estimation
Cost estimation is the process of predicting the expenses associated with a program, project, or business operation. The result of this process is called a cost estimate, which provides an approximate total cost and may also break down the costs into identifiable components.
A well-prepared cost estimate is essential for avoiding cost overruns and ensuring that resources are allocated efficiently. The professional responsible for preparing these estimates is known as a cost estimator.
Accurate and reliable cost estimates help managers plan effectively, make informed decisions, and maintain financial control over projects or operations.
The Goal of Cost Estimation
The main purpose of cost estimation is to figure out the fixed and variable components of a cost so that a cost formula can be created. This formula, often called a cost equation, allows businesses to predict future costs based on activity levels.
Since the primary factor in this case is the number of units produced, the relationship is typically linear, meaning the cost formula forms a straight line. You might remember from school math that the equation of a line looks like this:
Y = mX + b
Where:
Y = total cost
m = slope of the line, representing the variable cost per unit
X = number of units produced (activity level)
b = y-intercept, representing total fixed costs
In accounting, this is often written as:
Y = VC × X + TFC
Or expressed as a function:
f(X) = VC × X + TFC
Here, f(X) is the total cost, VC is the unit variable cost, and TFC is the total fixed cost. This is why it is called a cost function in accounting—because it links total cost directly to the level of activity.
Linear cost functions are extremely useful for predicting costs at different levels of production or activity. Managers rely on these predictions to:
- Prepare budgets
- Conduct what-if analyses
- Set pricing for products or services
- Plan for future operations and make key management decisions
By understanding how costs behave with changes in activity, businesses can make better
What is the OLS Regression
Ordinary Least Squares (OLS) regression is a key statistical method used in business and economics to estimate the relationship between a dependent variable and one or more independent variables. It identifies the line that best fits a dataset by minimizing the squared differences between observed and predicted values.
What is the OLS Regression Equation?
The linear cost function can be written as:
y = a + bx
Where:
y = total cost (dependent variable)
x = activity level (independent variable)
a = fixed cost
b = variable cost per unit
Normal Equations:
Σy = n × a + b × Σx
Σxy = a × Σx + b × Σx²
Direct Formulas:
b = (n × Σxy − Σx × Σy) / (n × Σx² − (Σx)²)
a = (Σy − b × Σx) / n
Characteristics of Linear Regression
- Provides an objective method to determine the line of best fit.
- Uses all data points in the dataset.
- Minimizes the sum of squared errors.
- Gives reliable predictions when the relationship is linear within the observed data ran
Solved Illustration
Suppose the following data shows units produced and total costs:
| Units Produced (x, hundreds) | Total Costs (y, Ksh ,000) |
| 1 | 42 |
| 2 | 47 |
| 3 | 52 |
| 4 | 64 |
| 5 | 71 |
| 6 | 73 |
| 7 | 81 |
Consider the following solutions
Step 1: Compute Sums
| x | y | xy | x² |
| 1 | 42 | 42 | 1 |
| 2 | 47 | 94 | 4 |
| 3 | 52 | 156 | 9 |
| 4 | 64 | 256 | 16 |
| 5 | 71 | 355 | 25 |
| 6 | 73 | 438 | 36 |
| 7 | 81 | 567 | 49 |
| Σ | 390 | 1,908 | 140 |
Step 2: use the direct formula to calculate Coefficients
b = (7 × 1,908 − 28 × 390) ÷ (7 × 140 − 28²) ≈ 12.43
a = (390 − 12.43 × 28) ÷ 7 ≈ 5.56
Formulate the regression equation
y = 5.56 + 12.43x
Example Prediction
For 250 units (x = 2.5):
y = 5.56 + 12.43 × 2.5 = 36.64
Since the cost is in thousands then;
36.64 x 1000 = Ksh 36,640
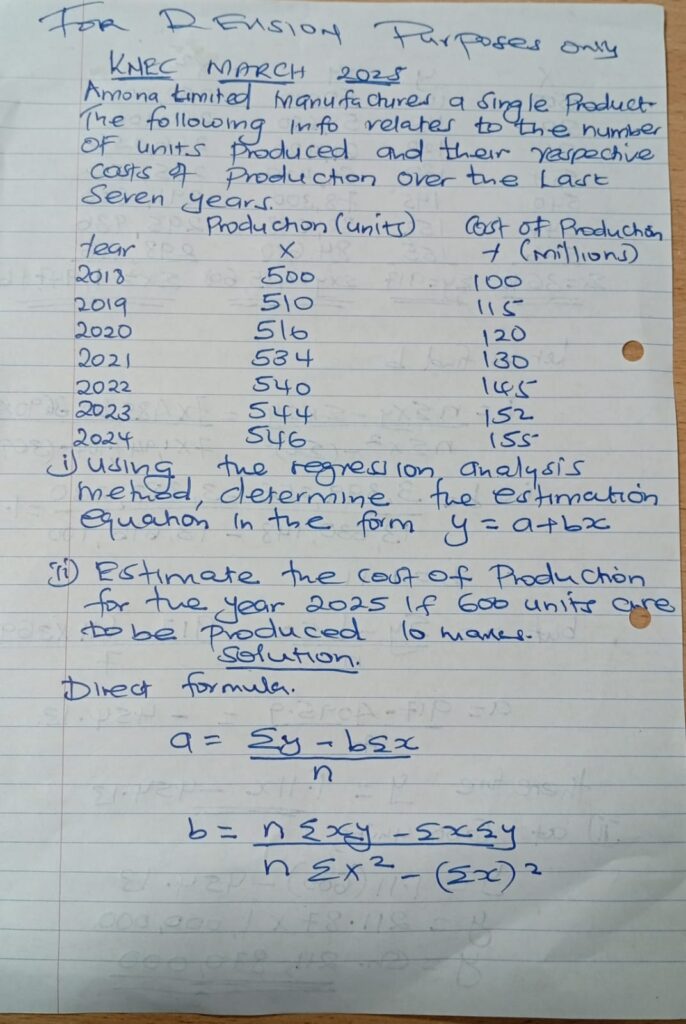
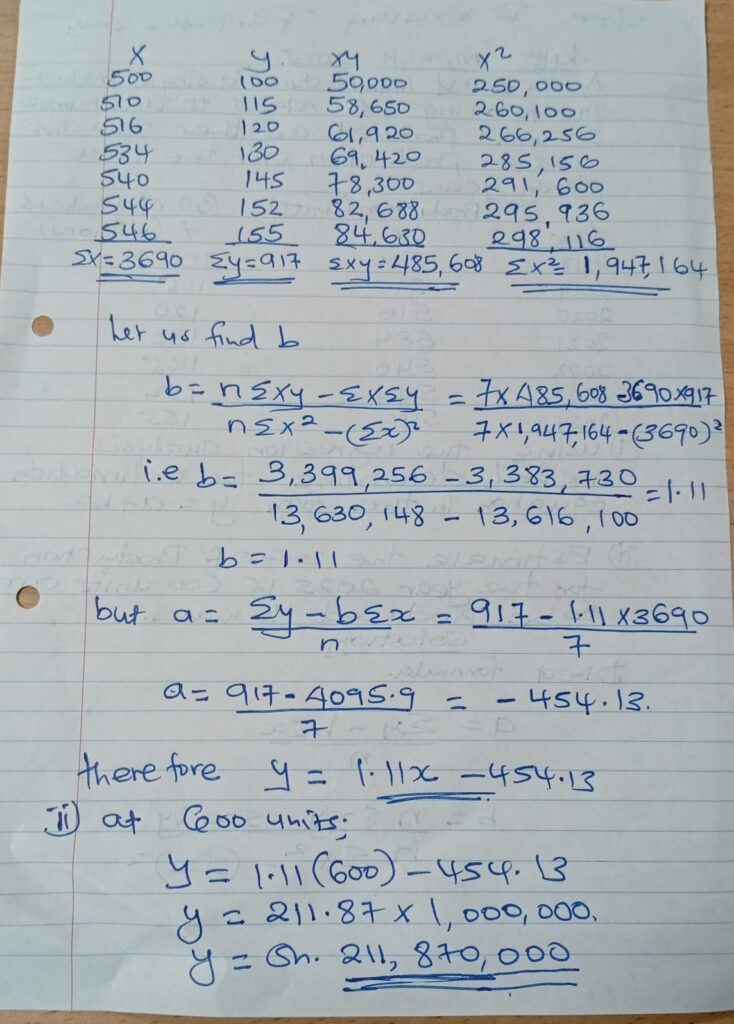
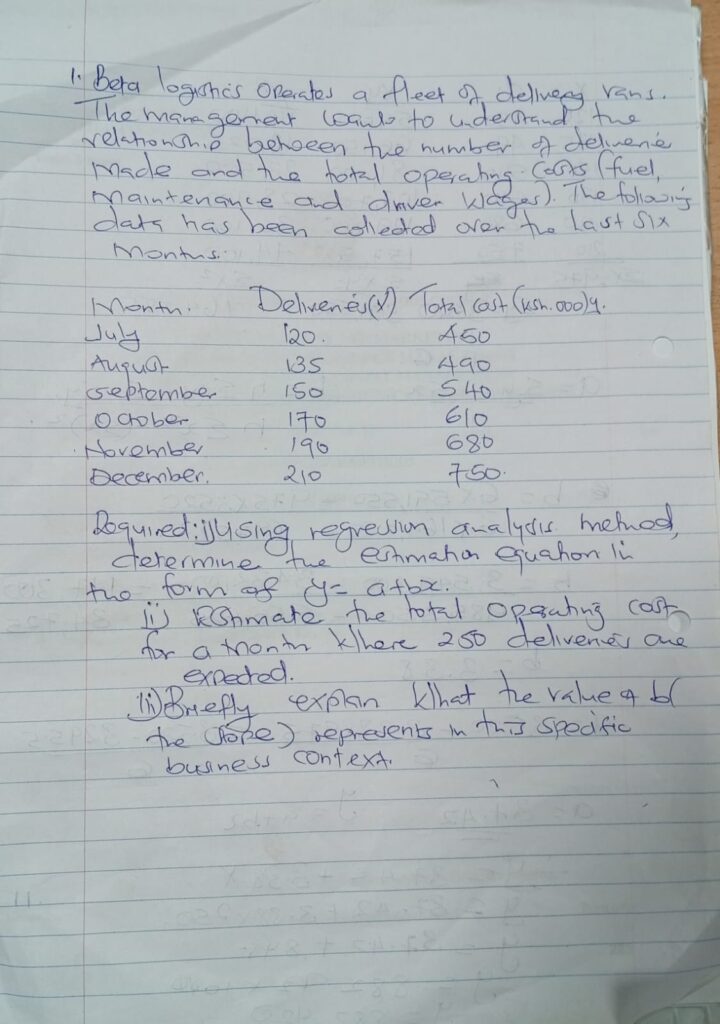
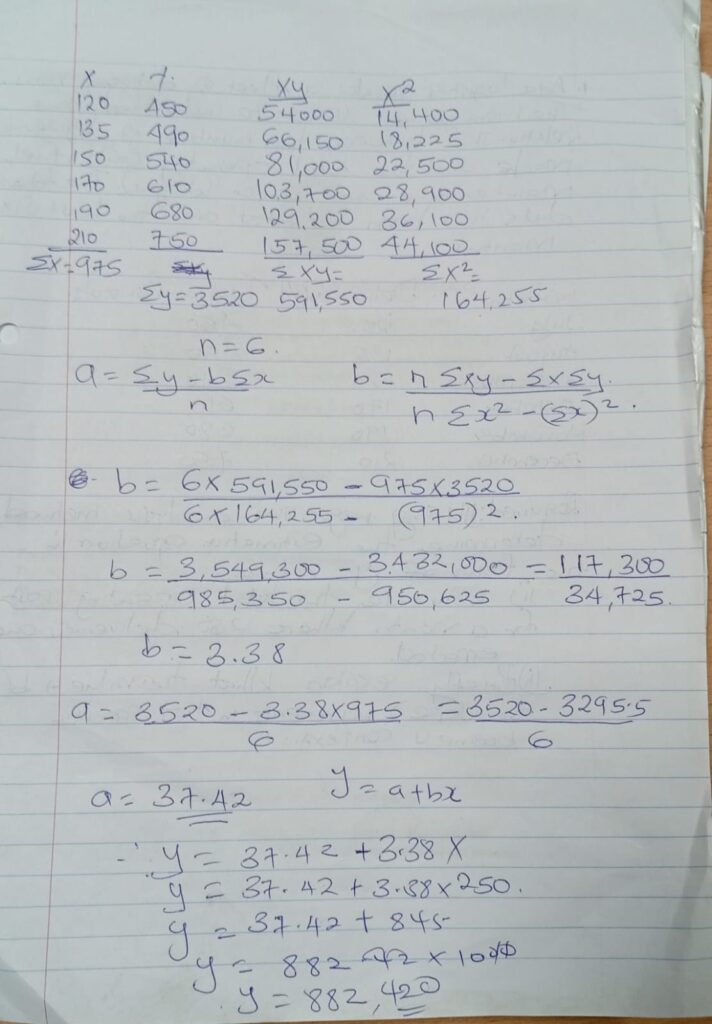
SOLVED KNEC 2025 MARCH ILLUSTRATION